Monitoring
Parsl includes a monitoring system to capture task state as well as resource usage over time. The Parsl monitoring system aims to provide detailed information and diagnostic capabilities to help track the state of your programs, down to the individual apps that are executed on remote machines.
The monitoring system records information to an SQLite database while a
workflow runs. This information can then be visualised in a web dashboard
using the parsl-visualize tool, or queried using SQL using regular
SQLite tools.
Monitoring configuration
Parsl monitoring is only supported with the parsl.executors.HighThroughputExecutor.
The following example shows how to enable monitoring in the Parsl
configuration. Here the parsl.monitoring.MonitoringHub is specified to use port
55055 to receive monitoring messages from workers every 10 seconds.
import parsl
from parsl.monitoring.monitoring import MonitoringHub
from parsl.config import Config
from parsl.executors import HighThroughputExecutor
from parsl.addresses import address_by_hostname

import logging

config = Config(
   executors=[
       HighThroughputExecutor(
           label="local_htex",
           cores_per_worker=1,
           max_workers=4,
           address=address_by_hostname(),
       )
   ],
   monitoring=MonitoringHub(
       hub_address=address_by_hostname(),
       hub_port=55055,
       monitoring_debug=False,
       resource_monitoring_interval=10,
   ),
   strategy='none'
)
Visualization
To run the web dashboard utility parsl-visualize you first need to install
its dependencies:
$ pip install ‘parsl[monitoring,visualization]’
To view the web dashboard while or after a Parsl program has executed, run
the parsl-visualize utility:
$ parsl-visualize
By default, this command expects that the default monitoring.db database is used
in the runinfo directory. Other databases can be loaded by passing
the database URI on the command line. For example, if the full path
to the database is /tmp/my_monitoring.db, run:
$ parsl-visualize sqlite:////tmp/my_monitoring.db
By default, the visualization web server listens on 127.0.0.1:8080. If the web server is deployed on a machine with a web browser, the dashboard can be accessed in the browser at 127.0.0.1:8080. If the web server is deployed on a remote machine, such as the login node of a cluster, you will need to use an ssh tunnel from your local machine to the cluster:
$ ssh -L 50000:127.0.0.1:8080 username@cluster_address
This command will bind your local machine’s port 50000 to the remote cluster’s port 8080.
The dashboard can then be accessed via the local machine’s browser at 127.0.0.1:50000.
Warning
Alternatively you can deploy the visualization server on a public interface. However, first check that this is allowed by the cluster’s security policy. The following example shows how to deploy the web server on a public port (i.e., open to Internet via public_IP:55555):
$ parsl-visualize --listen 0.0.0.0 --port 55555
Workflows Page
The workflows page lists all Parsl workflows that have been executed with monitoring enabled with the selected database. It provides a high level summary of workflow state as shown below:
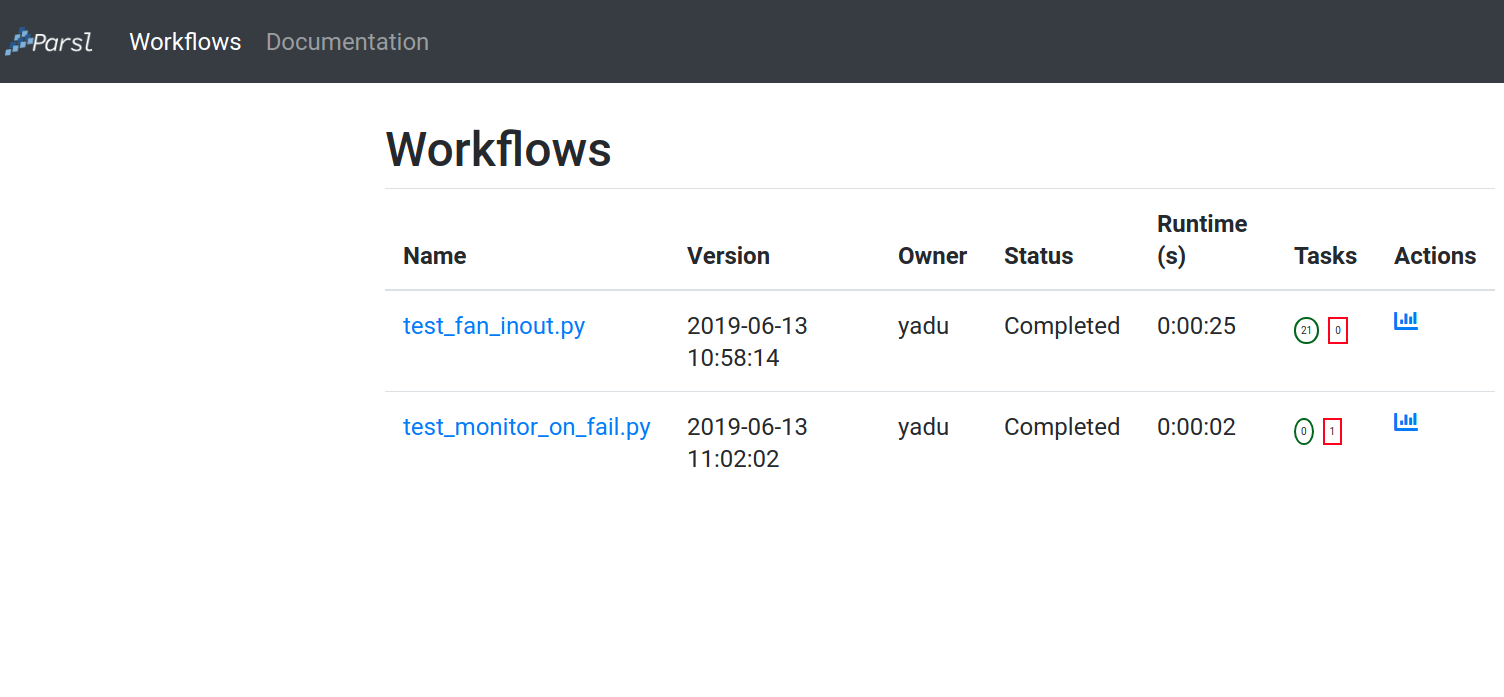
Throughout the dashboard, all blue elements are clickable. For example, clicking a specific worklow name from the table takes you to the Workflow Summary page described in the next section.
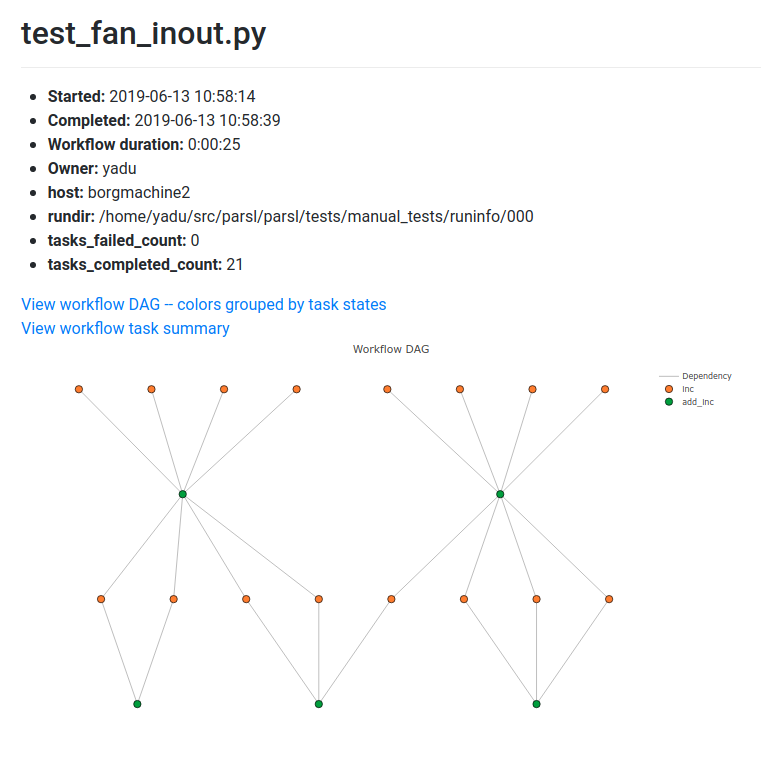
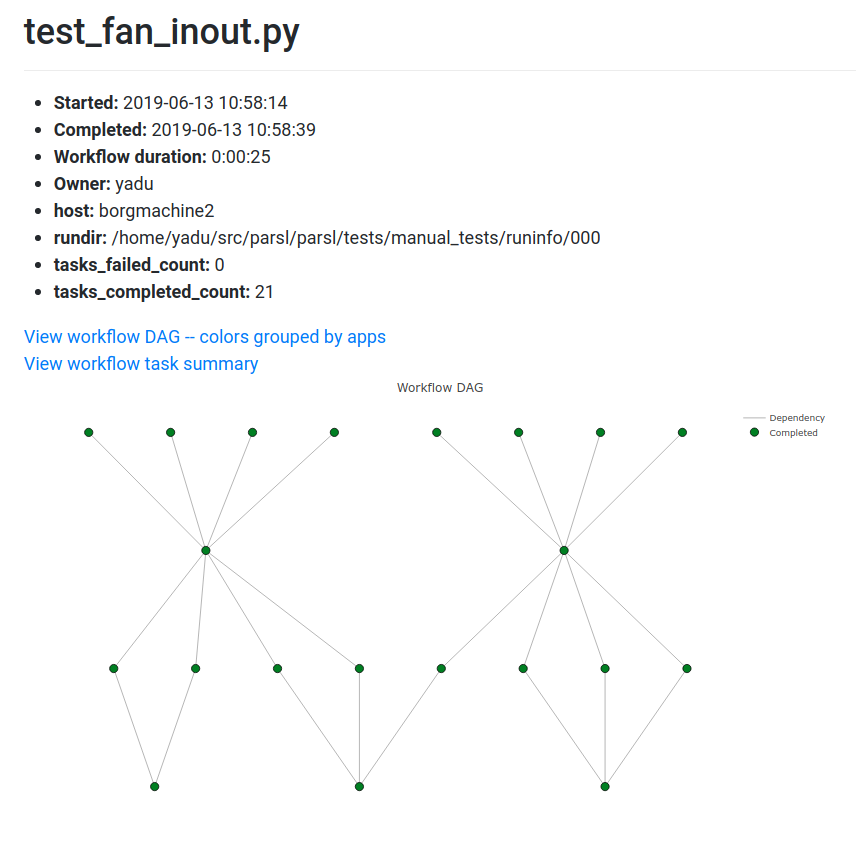
Workflow Summary
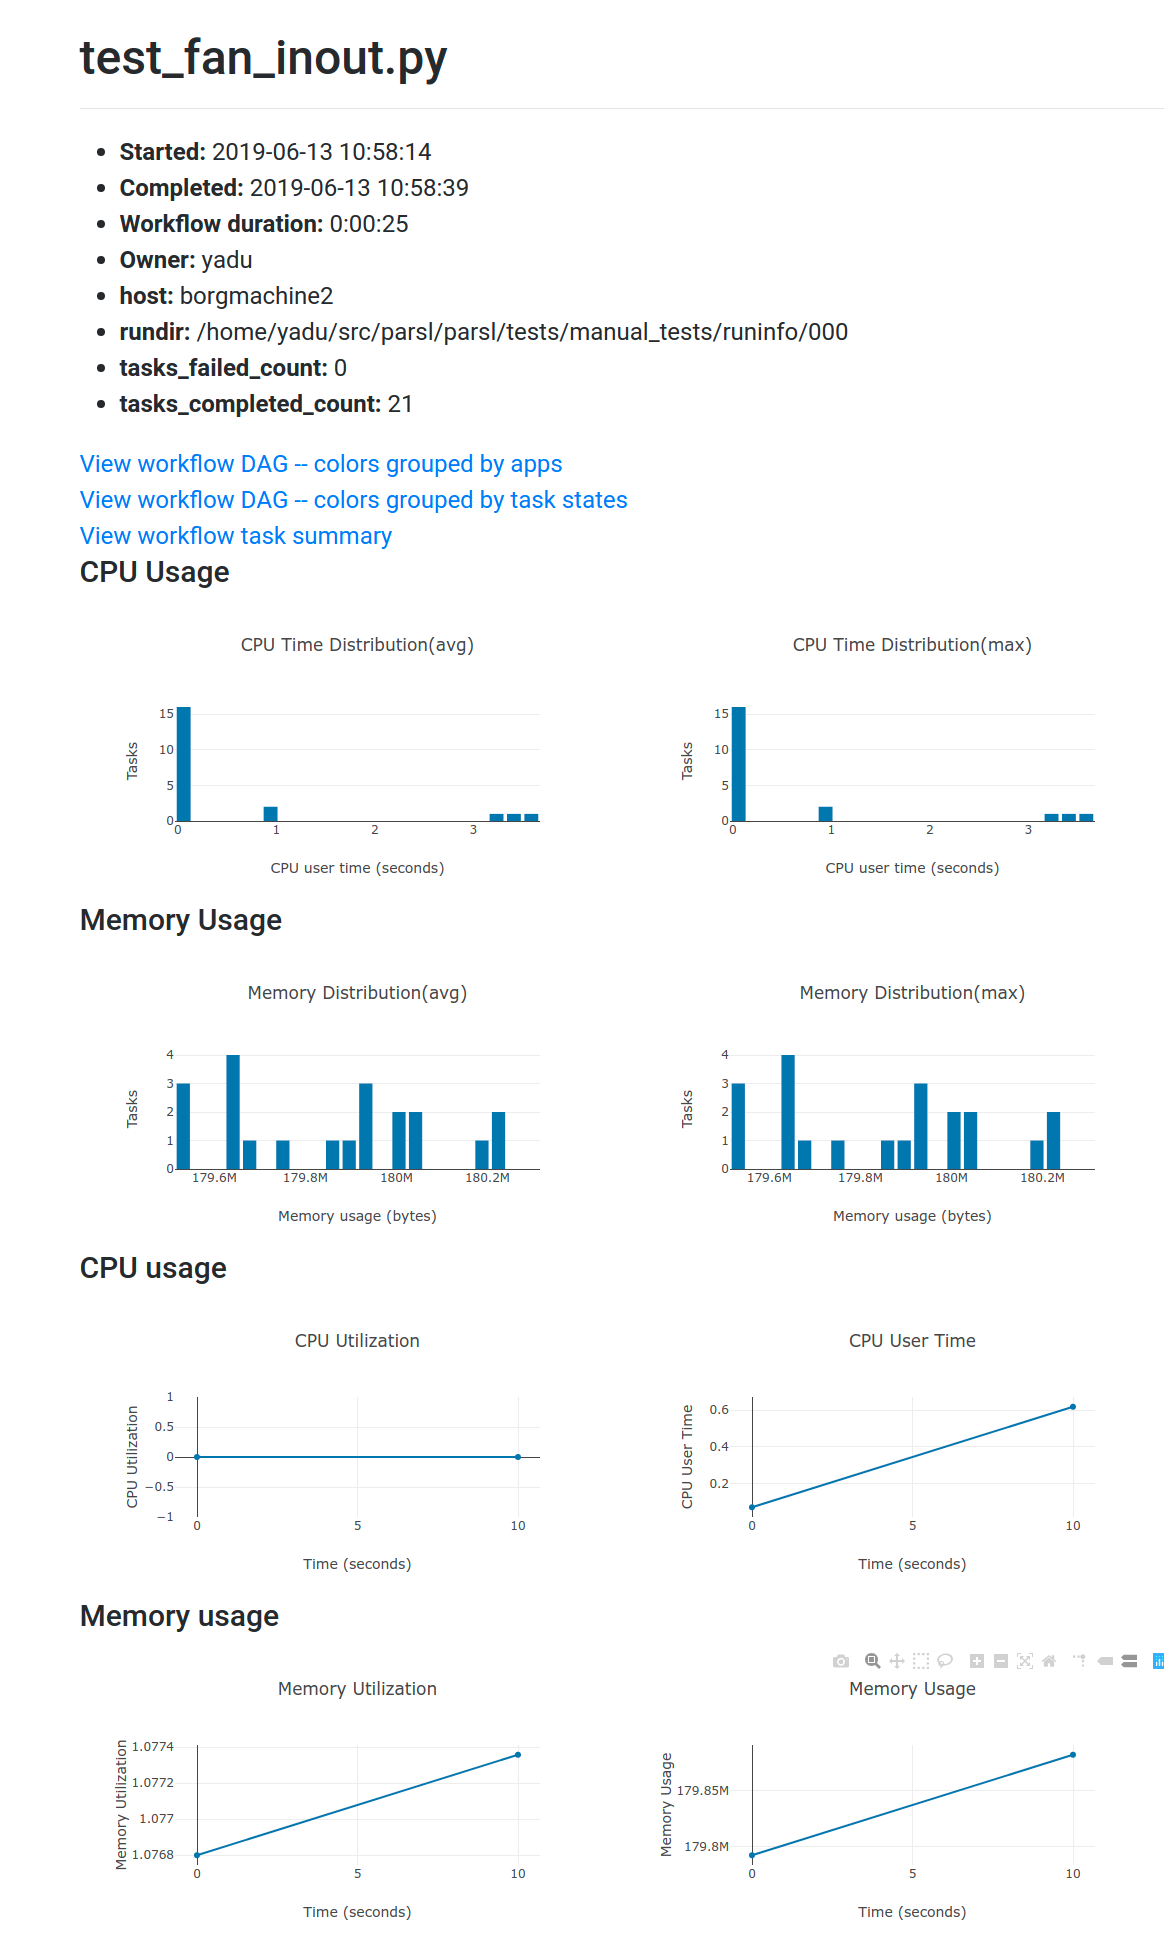
The workflow summary page captures the run level details of a workflow, including start and end times as well as task summary statistics. The workflow summary section is followed by the App Summary that lists the various apps and invocation count for each.
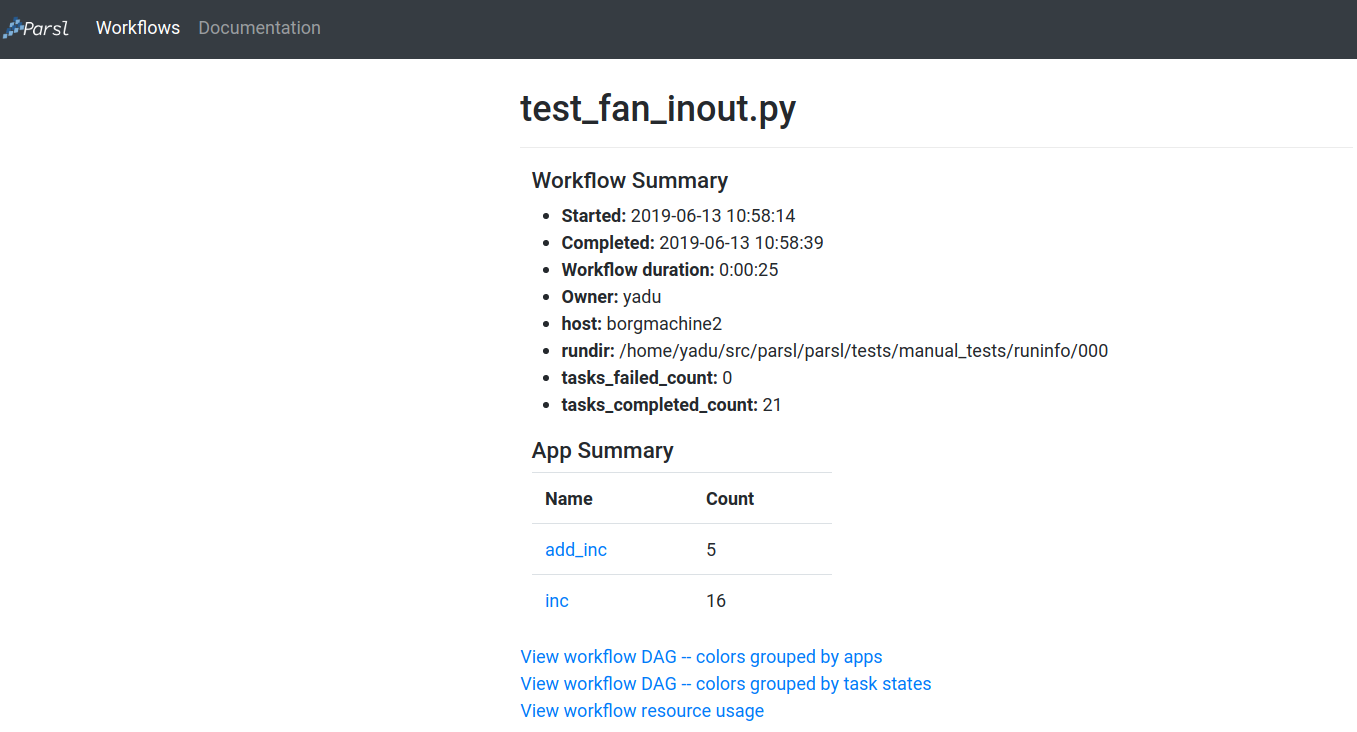
The workflow summary also presents three different views of the workflow:
Workflow DAG - with apps differentiated by colors: This visualization is useful to visually inspect the dependency structure of the workflow. Hovering over the nodes in the DAG shows a tooltip for the app represented by the node and it’s task ID.
Workflow DAG - with task states differentiated by colors: This visualization is useful to identify what tasks have been completed, failed, or are currently pending.
Workflow resource usage: This visualization provides resource usage information at the workflow level. For example, cumulative CPU/Memory utilization across workers over time.