Monitoring
Parsl aims to make the task of running parallel workflows easy by providing monitoring and diagnostic capabilities to help track the state of your workflow, down to the individual applications being executed on remote machines. To enable Parsl’s monitoring feature for your workflow, you will need a few additional packages.
Installation
Parsl’s monitoring model relies on writing workflow progress to a sqlite database and using separate tools that query this database to create a web-based dashboard for the workflow.
Monitoring configuration
Here’s an example configuration that logs monitoring information to a local sqlite database:
import parsl
from parsl.monitoring.monitoring import MonitoringHub
from parsl.config import Config
from parsl.executors import HighThroughputExecutor
from parsl.addresses import address_by_hostname

import logging

config = Config(
   executors=[
       HighThroughputExecutor(
           label="local_htex",
           cores_per_worker=1,
           max_workers=4,
           address=address_by_hostname(),
       )
   ],
   monitoring=MonitoringHub(
       hub_address=address_by_hostname(),
       hub_port=55055,
       monitoring_debug=False,
       resource_monitoring_interval=10,
   ),
   strategy=None
)
Visualization
Run the parsl-visualize utility:
$ parsl-visualize
If your monitoring database is not the default of monitoring.db in the current working directory,
you can specify a different database URI on the command line. For example, if the full path
to your monitoring.db is /tmp/monitoring.db, run:
$ parsl-visualize sqlite:////tmp/monitoring.db
By default, the visualization web server listens on 127.0.0.1:8080. If you are running on a machine with a web browser, you can access viz_server in the browser via 127.0.0.1:8080. If you are running on the login node of a cluster, to access viz_server in a local machine’s browser, you can use an ssh tunnel from your local machine to the cluster:
$ ssh -L 50000:127.0.0.1:8080 username@cluster_address
This binds your local machine’s port 50000 to the remote cluster’s port 8080. This allows you to access viz_server directly on your local machine’s browser via 127.0.0.1:50000.
Warning
Below is an alternative to host the viz_server on a cluster, which may violate the cluster’s security policy. Please check with your cluster admin before doing this.
If the cluster allows you to host a web server on its public IP address with a specific port (i.e., open to Internet via public_IP:55555), you can run:
$ parsl-visualize --listen 0.0.0.0 --port 55555
Workflows Page
The workflows page lists all instances of a Parsl workflow that has been executed with monitoring turned on. It also gives a high level overview of workflow runs as a table as shown below:
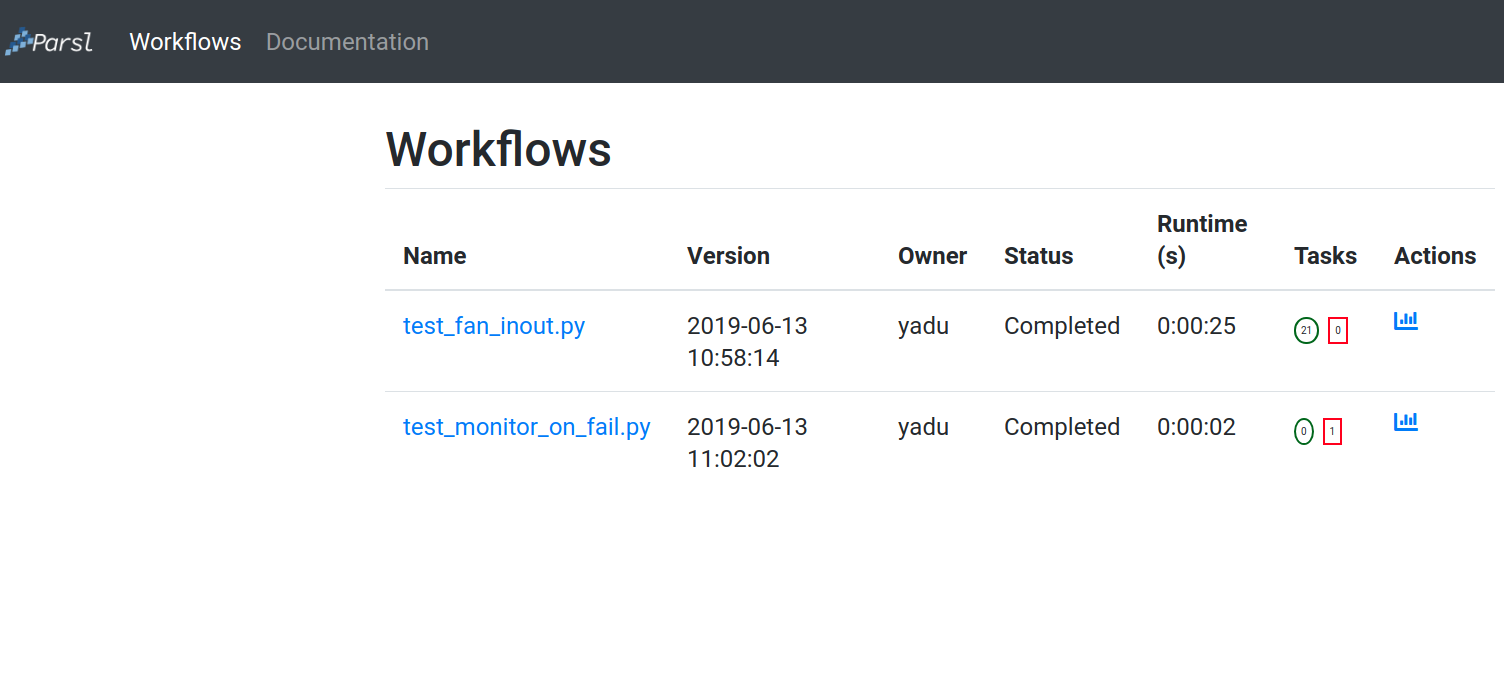
Throughout the visualization pages, all blue elements are clickable. For eg, clicking a specific worklow name from the table takes you to the Workflow Summary page described in the next section.
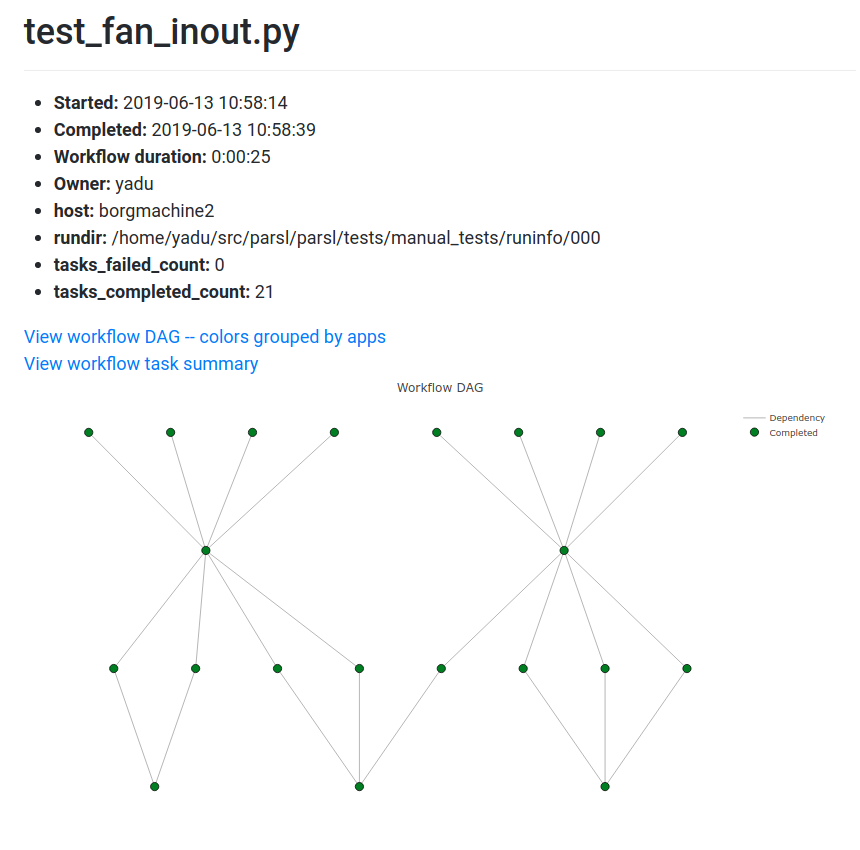
Workflow Summary
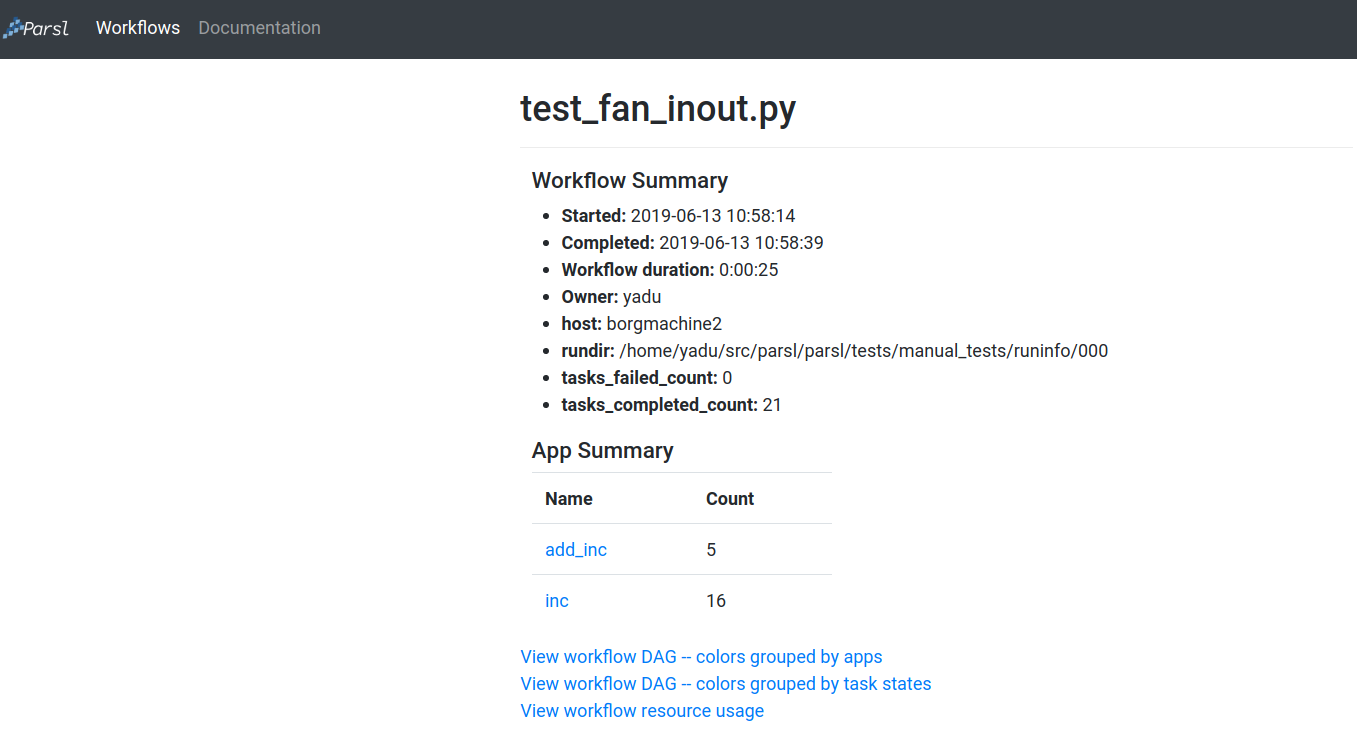
The above screenshot of the workflow summary page captures the run level details such as start and end times as well as task summary statistics. The workflow summary section is followed by the App Summary that lists the various apps and count of invocations each. This is followed by three different views of the workflow:
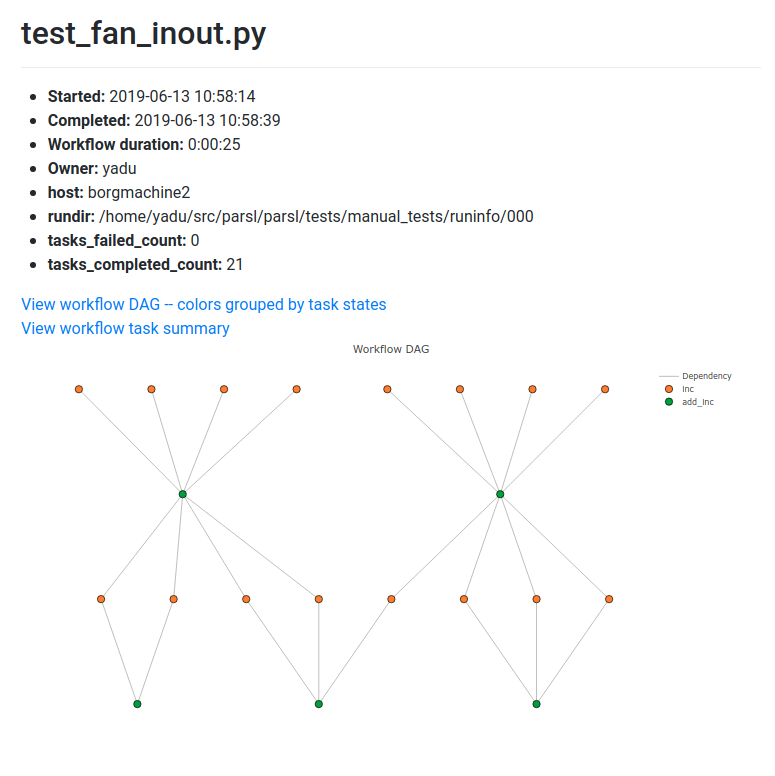
- Workflow DAG - colors grouped by apps: This visualization is useful to visually inspect the dependency structure of the workflow DAG. Hovering over the nodes in the DAG shows a tooltip for the app that the node represents and it’s task ID.
- Workflow DAG - colors grouped by task states: This visualization is useful to identify what stages in the workflow are complete and what stages are pending.
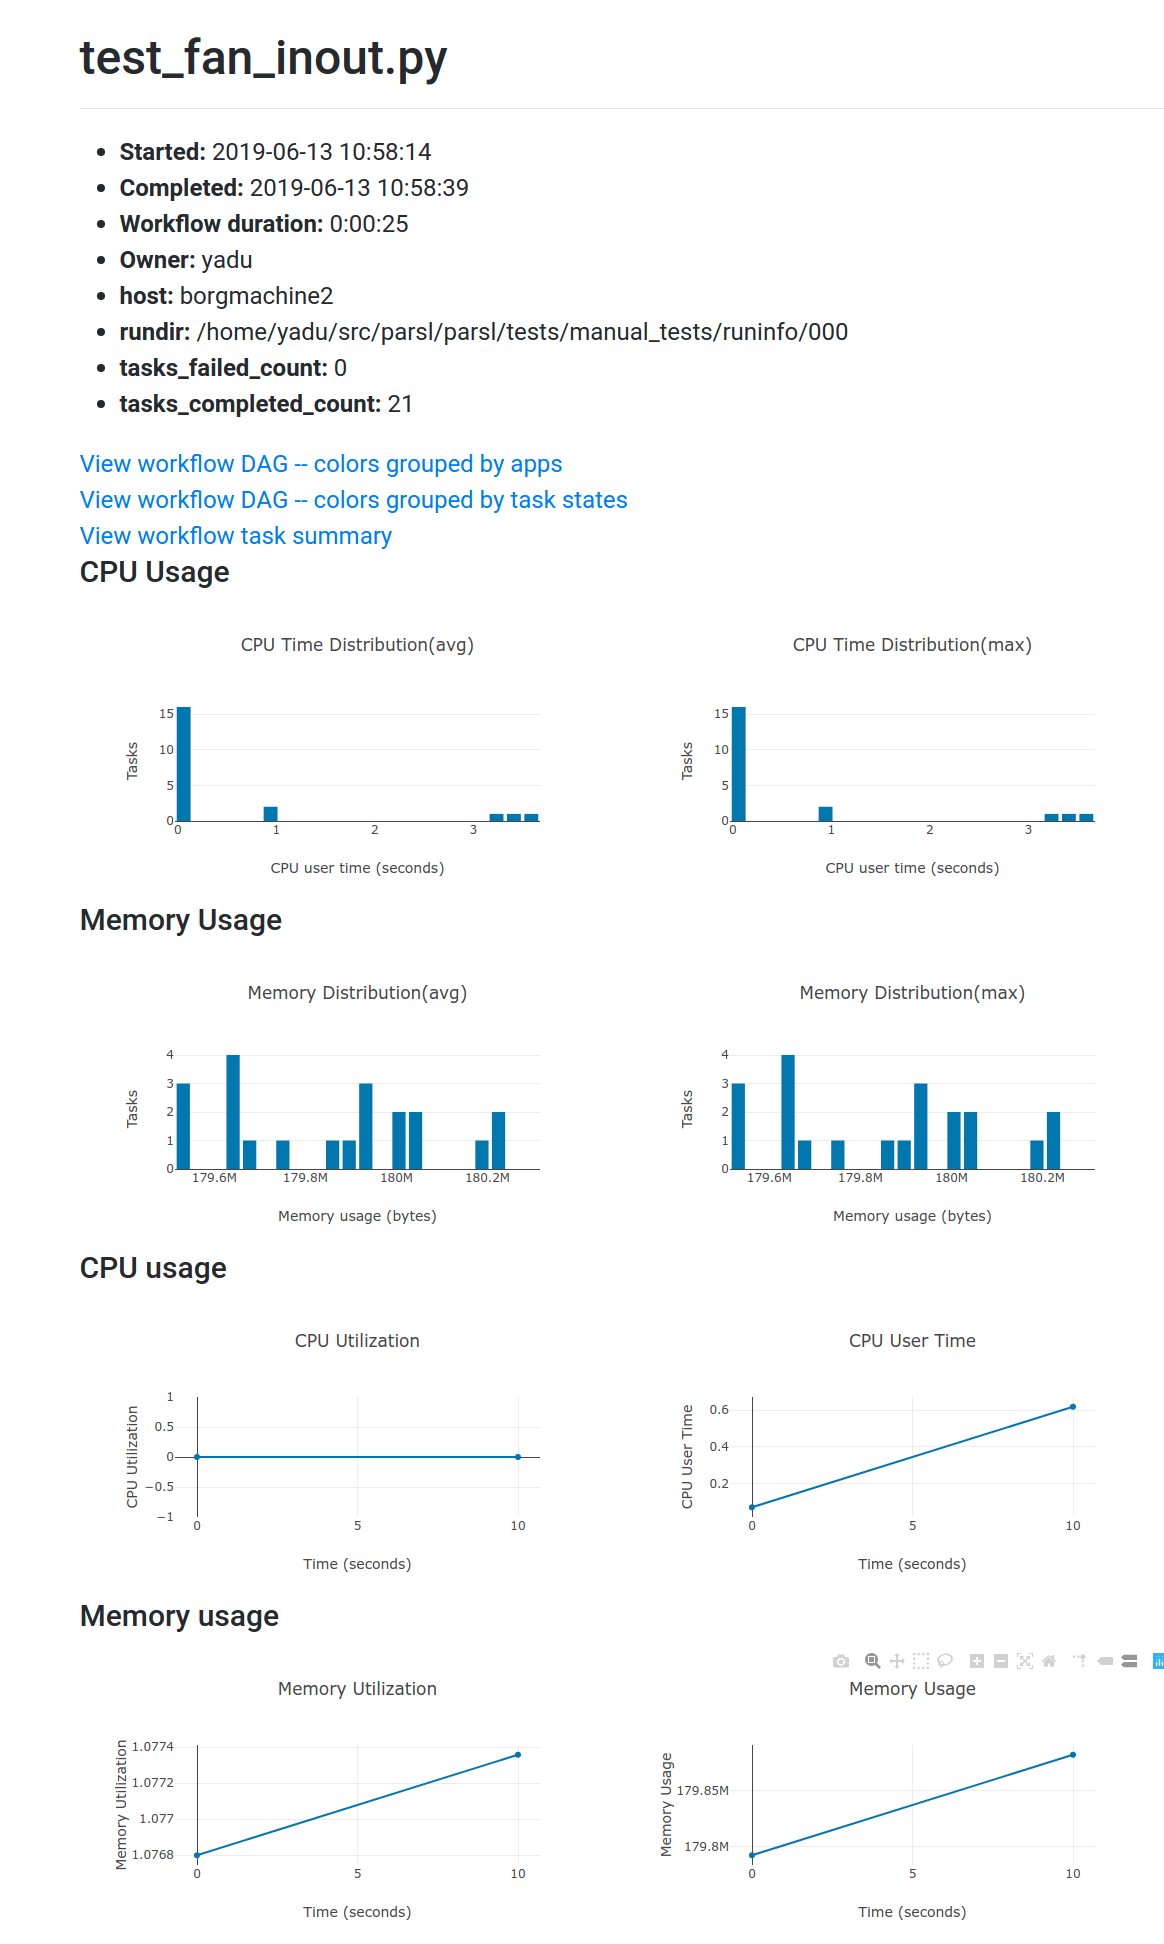
- Workflow resource usage: This visualization provides resource usage information at the workflow level. For eg, cumulative CPU/Memory utilization across workers over time.